Some election statistics
Analysing the election results
I came across a number of interesting articles about the election over the weekend, (both in Russian), comparing the number of votes won by candidates with the amount each spent as part of their campaign, which attracted the attention of the former Maths teacher in me.
The first compared the cost of each vote whilst a second addressed the question of the correlation between the two figures.
.
.
Here’s a table giving a summary of the data:
| Candidate |
Votes |
Campaign |
Campaign |
Cost/vote (som) |
||
| Atambaev |
1175344 |
43578600 |
968413 |
37 |
||
| Madumarov |
274434 |
27423678 |
609415 |
100 |
||
| Tashiev |
266192 |
20312290 |
451384 |
76 |
||
| Asanbek |
17201 |
2940000 |
65333 |
171 |
||
| Suvanaliev |
16169 |
517510 |
11500 |
32 |
||
| Bakir |
15558 |
7503349 |
166741 |
482 |
||
| Baibalov |
15384 |
19974833 |
443885 |
1298 |
||
| Kalmatov |
13623 |
10775019 |
239445 |
791 |
||
| Abdylmatov |
8759 |
6494378 |
144320 |
741 |
||
| Imankulov |
5736 |
704800 |
15662 |
123 |
||
| Isabekov |
3288 |
7054480 |
156766 |
2146 |
||
| Osmonov |
2452 |
503500 |
11189 |
205 |
||
| Aitkeev |
2103 |
703690 |
15638 |
335 |
||
| Kolubaev |
1947 |
100200 |
2227 |
51 |
||
| Dyikanov |
1358 |
679317 |
15096 |
500 |
||
| Karimov |
1310 |
287850 |
6397 |
220 |
||
| Against All |
9438 |
*Approximate, I have used an assumed exchange rate of USD1 = 45 som
As I often say: “statistics raise more questions than they answer”, and these are no exception.
It looks, for example, as if the average cost of a vote was 457 som, although the articles suggest it was just 84 som. This discrepancy arises because, for some reason, the author limited his analysis to just the top 11 candidates; those who attracted more than 3000 votes. He presumably wanted to eliminate, (or at least minimize), any distorting effects that these lower figures might have on the figures, (such as inflating the average cost of a vote), but doesn’t explain why he chose this cut-off point apart from suggesting that this probably reflects the personal votes of family and friends – so votes that aren’t “bought” or obtained through the advertising. Indeed, one of the candidates, (who was in the top 11), expressed surprise at how few votes he managed to gain from his home village, suggesting that this is indeed a factor that should be taken into account. (Logic suggests to me, therefore, that perhaps we ought to deduct this figure from all the candidates before doing the calculations, but let’s let that pass.) In fact, his choice of cut-off point hasn’t affected the range, (from 32 som to 2146 som per vote), which is in itself quite considerable.
Then there is the fact that the figures in the Campaign Fund column represent the official reported figures, but Atambaev, in particular, was the beneficiary of adverts placed by other parties in his support, and presumably paid for by them and so not included in these figures.
Also, there were reports on election day of someone apparently offering voters 500 som, (about USD11), to vote for a particular candidate although it’s not clear if anyone took him up on the offer, and, if they did, it probably wouldn’t be reflected here … which leads to a question: if there were other “unreported expenses”?
Still, it’s clear from this that Atambaev spent the most, and achieved the highest vote – winning the election.
The other issue that was considered was if there was a correlation between the amount spent by a candidate and the number of votes they managed to gain.
During the early days of the process, many of the original 83 presidential wannabes were complaining about two of the requirements in the process, the need to pay a 100,000 deposit, (returned in the event that they got over 5% of the vote), and having to collect some 30,000 signatures in support of their candidacy. These, they argued, favoured the rich candidates and prevented poorer members of the community from exercising their “constitutional right” to contest the election, and so they “demanded” these provisions be revoked.
For the record: One of the features of this particular election was the number of candidates who described themselves on their nomination papers as “unemployed” and who, presumably, were without substantial funds to use in their pursuit of the highest office in the land.
In a way, these protests are right, but that doesn’t mean that these are a bad thing in themselves. They are meant to help prevent “frivolous” candidacies – after all the election process costs the taxpayers money and aren’t really meant to be used for the purposes of self aggrandizement.
On the other hand, such nominations are not always for the purpose of self promotion. There are times when ordinary individuals want to make “a stand against the system” and encourage protest votes.
For example: there was the case of Reg Keys, the father of a soldier killed in Iraq, who stood against Tony Blair in the 2005 General Election, on the single issue platform of opposition to the government’s policy on the Iraq and the war in Iraq. Although Tony Blair was comfortably re-elected, Keys got 4,252 votes (10.3% of the total), coming in fourth place not far behind the candidates from the main opposition parties.
Then there was the BBC correspondent Martin Bell who stood against the sitting conservative MP Neil Hamilton, (who was the subject of many allegations of “sleaze”) in the 1997 General Election. Bell succeeded in overturning a substantial conservative majority, capturing the seat and taking his place in Parliament as a truly independent MP.
Perhaps the most celebrated protest vote candidate in Britain was Screaming Lord Sutch. A musician in the 1960’s he contested 41 elections before his death in 1999. Only once did he receive more than 1000 votes, (which represented just 4.2% of the vote) and losing his deposit every single time. His first election was contested as a candidate for the National Teenage Party, but going on in 1983 to found the Official Monster Raving Loony Party. Although they are sometimes seen a “joke”, with a manifest containing things that seem to be impossible or absurd, they have had some success, with members being elected to local councils, (sometimes unopposed, but not always), and some of their proposals, (such as lowering the voting age to 18, passports for pets, and “all day opening for pubs” have made it into legislation and it was a “Loony” who created a scandal revealing that under European Community rules milk and butter surpluses were “being dumped down mineshafts” in order to maintain price levels.
No doubt some of the 83 candidates that submitted proposals represented the protest vote, (anyway, the ballot paper included a protest vote option – “Against all” which attracted a considerable 9483 votes … and there were a considerable amount of “spoilt papers”), or single issue candidates, (there was one candidate who seemed to have one issue foremost in his campaign; “I am for dual citizenship with Russia”).
In the West, this question of “funding democracy” has long been an issue. Millions of pounds are spent by parties and individual candidates in a British General election and lions of dollars in a American election. Even on these figures the candidates spent over three million dollars between them.
Using a statistical analysis, the article pointed out that there did appear to be a correlation between the amount spent and where a particular candidate appeared in the final results. The correlation coefficient when considering all the candidates is 0.78, (and based on just the candidates who received more than three thousand votes it was 0.86). That’s quite high; a perfect correlation would give a result of plus or minus 1.
Doing a regression analysis, however, does not produce such convincing results. The author using just the top 11 candidates gets a line of regression which shows only Atambaev lying above the line; that is receiving more votes than the analysis might predict for him given his level of expenditure. Including the bottom five candidates skews the line a little, giving a slightly better picture, but still not very convincing. It seems clear that that statistical adage that “correlation does not mean causation” is true. There may be a relationship between the amount spent and the number of votes gained, but there were other factors at play as well, which are less easy to quantify; such as the authority of the candidate of the people, the appeal of his views and beliefs to voters, value for money of the way the election fund was used, and so on.
Despite the lack of a causal connection between election expenses and the eventual results, this question of “funding democracy” is an important one. It is a hot topic, for example, in both the United States and Britain. A recent survey suggested that something like 60% of nations offer some form of public funding for political parties to help defray the costs of elections. Sometimes this funding is given to the central party apparatus, but in other cases it is given direct to the candidate.
There is a good case to be made for state funding for political parties. Although parties should be able to rely on their supporters for finance, dependency on fund raising activities and private donations opens a party to undue influence from individuals and pressure groups. The overall aim of state funding both in the States and Britain has been to stop corruption in election finance, but even in those countries which do provide a measure of finance from the public purse, there are still occasional stories of “sleaze” and “graft”; Tony Blair was accused of setting the price of the Labour Party conscience at one million pounds after a donation of that size appeared to lead to a change in policy exempting Formula One racing from a ban on tobacco advertising; and the sale of posts such as Ministerial responsibility, or honours, or contracts.
As “part of the deal” schemes for providing state financial support often include caps on the size of donations, (sometimes with a requirement for public declarations of donations above a certain threshold), and election spending, (with an aim to “leveling the playing field” in order to help less well off campaigns as well as protecting political parties from an ever increasing spiraling in costs likely to damage if not bankrupt parties).
The Jogorku Kenesh have also been debating the topic and it looks as if they will decide to provide state funds for political parties based on their performance in the previous election. That means that five parties that have seats in the current parliament will receive funding, but the others won’t. That means that the Butun party which narrowly missed out on obtaining seats in the last election, due to late changes in the election register, won’t receive any state financing.
I understand that the UK is currently considering a similar system linking state contributions to the number of votes won by the party at the previous election – but without the limit which would hit the Butun Party and count against new parties trying to break into the system, such as UKIP in Britain.
There are other ways of financing parties, apart from basing it performance at previous elections, such as providing for Tax relief on donations, (as is often the case with charitable donations – perhaps over a particular threshold and up to a capped limit), or matched funding of private donations, (up to a limit) as I believe is the case in Germany.
Whatever the source of funding, and no system strikes me as ideal, it is important that it is spent wisely. As well as looking at the results in Sunday’s election, remember the experience of the UK Independence Party, (UKIP), which spent some twenty million pounds campaigning, yet achieved not a single seat.
These weren’t the only webpages that provided a mass of statistical data. The Central Election Commission ran their own site, (http://cec.shailoo.gov.kg/) which provided official data as the results came in polling station by polling station. The tables were then reposted on many of the news services.
Perhaps the most interesting article, however, was “Mapping Kyrgyzstan’s Regional Divisions, Vote by Vote” on the eurasianet.org site. It didn’t have tables of figures, but did have one graphic – a map of the country showing Atambaev’s share of the vote in different electoral districts around the country:
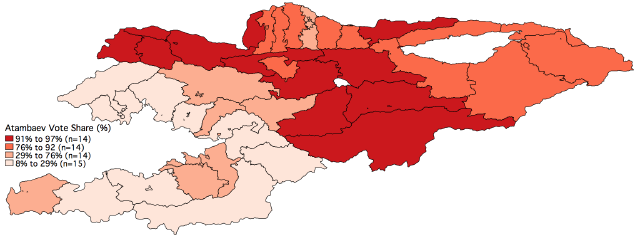
The map was produced by Dr. Fredrik M. Sjoberg, a visiting scholar at New York University, and created with data from Kyrgyzstan’s Central Election Commission.
Here is clearly visible the one thing that has dominated political debate in the country: the North-South divide. It seems obvious from the graphic that there is a political and social fault line, mirroring the geological fault line that cuts across the country from the South East to the North West, and implying that there is an awful lot of work ahead of the president elect if he is going to be able to resolve it and unify the country.






 Bishkek